Abstract
The North Shewa zone of Ethiopia is highly vulnerable to drought. The majority of the population of the zone is involved in agricultural activities for their livelihood. Agriculture is predominantly dependent on the timing, amount, duration, and distribution of natural rainfall. This makes the zone susceptible to the impacts of climatic extreme events such as drought. Yet, no drought assessment studies have been conducted on the spatial and temporal analysis of recent droughts over the zone. In view of that, this study examined the spatial and temporal characteristics of drought in the period 1990 to 2020 over the North Shewa zone of Oromia regional state, Ethiopia, using the Standardized Precipitation Index (SPI) drought index. The drought events at each of the stations had varying magnitudes and occurrences. During Kiremt (JJAS), seasonal drought was more frequent than Belg (FMAM). The years 2006, 1998, 2013, and 2016 are the top driest seasons in Belg (ordered from high to low spatial coverage); and 1992, 2009, 1990, 2012, and 2015 are the years when there was the highest spatially spread drought in the Kiremt (June-September) season. The comparison between the performance of Raw, Adjusted, and Merged datasets in terms of with relation to CORR, BR2, BIAS, and RMSE. The results show that merged data is stronger than row and adjusted data in reproducing the observed station data.
Keywords
Drought, SPI, CHRIPSv2, Oromia
1. Introduction
Drought is inarguably one of the most challenging and complex natural disasters from a management perspective
| [1] | M. V. K. Sivakumar, R. Stefanski, M. Bazza, S. Zelaya, D. Wilhite, and A. R. Magalhaes, “High level meeting on national drought policy: Summary and major outcomes,” Weather Clim. Extrem., vol. 3, pp. 126-132, 2014,
https://doi.org/10.1016/j.wace.2014.03.007 |
| [2] | G. Laaha et al., “The European 2015 drought from a hydrological perspective,” Hydrol. Earth Syst. Sci., vol. 21, no. 6, pp. 3001-3024, 2017, https://doi.org/10.5194/hess-21-3001-2017 |
| [3] | D. A. Wilhite, “Drought,” in International Perspectives on Natural Disasters: Occurrence, Mitigation, and Consequences, Springer, 2007, pp. 147-162. |
[1-3]
. It has been a part of the climate, and it has affected many countries in the world this including Ethiopia and the Horn of Africa, and many other Sub-Saharan countries
| [4] | A. P. A. Gutiérrez, N. L. Engle, E. De Nys, C. Molejón, and E. S. Martins, “Drought preparedness in Brazil,” Weather Clim. Extrem., vol. 3, pp. 95-106, 2014,
https://doi.org/10.1016/j.wace.2013.12.001 |
[4]
. Among the developed countries, Australia, Brazil, and California State in the USA have a history of drought. It is now fully recognized that drought is a global climatic phenomenon, although the factors that cause it are not yet fully and convincingly explained
| [5] | B. I. Cook, J. S. Mankin, and K. J. Anchukaitis, “Climate change and drought: From past to future,” Curr. Clim. Chang. Reports, vol. 4, no. 2, pp. 164-179, 2018. |
[5]
. Drought is described by many as an insidious natural hazard that has a slow onset and develops over months or even years to reach a full-blown impact
| [6] | M. R. Pantula, Drought early warning system: Identification of onset end magnitude (SPI and SPEI) and composite index. Notion Press, 2016. |
[6]
. In its final stage of occurrence, it often covers a large geographic area or region
| [7] | J. Spinoni, G. Naumann, H. Carrao, P. Barbosa, and J. Vogt, “World drought frequency, duration, and severity for 1951-2010,” Int. J. Clim., vol. 34, no. 8, pp. 2792-2804, 2014. |
[7]
.
Drought occurs when the seasonal precipitation drops below normal or long-term average
| [8] | D. A. Wilhite, M. J. Hayes, and C. L. Knutson, “Drought preparedness planning: Building institutional capacity,” Drought water Cris. Sci. Technol. Manag. issues, vol. 107, pp. 93-136, 2005. |
[8]
. Drought in Ethiopia occurs during different seasons that occur in different regions in the country, and it exists when seasonal rainfall drops below normal by almost 30% to 50%. Some argue that it is difficult to give a universal definition for drought because drought is a complex phenomenon
| [9] | P. Webb and J. Van Braun, “Drought and food shortages in Ethiopia,” A Prelim. Rev. Eff. policy Implic. IFPRI, Washingt. DC, 1990. |
[9]
. However, several authors have given their version of the definition of drought or discussed it. Its definitions in their articles
| [10] | J. A. Dracup, K. S. Lee, and E. G. Paulson Jr, “On the definition of droughts,” Water Resour. Res., vol. 16, no. 2, pp. 297-302, 1980, https://doi.org/10.1029/WR016i002p00297 |
| [11] | D. A. Wilhite and M. H. Glantz, “Understanding: the drought phenomenon: the role of definitions,” Water Int., vol. 10, no. 3, pp. 111-120, 1985,
https://doi.org/10.1080/02508068508686328 |
| [12] | H. Hisdal, “Regional aspects of drought,” Disertation. Fac. Math. Nat. Sci. Univ. Oslo, Norge, 2002. |
[10-12]
. The simplest definition of drought from a hydrological point of view is given as “a deficit of water compared with normal conditions
. As it is indicated in the impact of drought is governed by its intensity, duration, frequency, and spatial extent of the precipitation deficit. Intensity refers to the amount of precipitation or water storage deficit at a particular place and specific time, which is classified as mild, moderate, severe, and extreme
| [14] | A. Zargar, R. Sadiq, B. Naser, and F. I. Khan, “A review of drought indices,” Environ. Rev., vol. 19, no. 1, pp. 333-349, 2011,
https://doi.org/10.1139/a11-013 |
| [15] | M. A. Degefu and W. Bewket, “Trends and spatial patterns of drought incidence in the Omo-Ghibe River Basin, Ethiopia,” Geogr. Ann. Ser. A Phys. Geogr., vol. 97, no. 2, pp. 395-414, 2015,
https://doi.org/10.1111/geoa.12080 |
[14, 15]
. Frequency is the average time between successive drought events, and duration refers to the extent of time that a given drought event stays
| [16] | T. B. McKee, N. J. Doesken, and J. Kleist, “The relationship of drought frequency and duration to time scales,” in Proceedings of the 8th Conference on Applied Climatology, California, 1993, pp. 179-183. |
[16]
. The spatial coverage refers to the areal extent of a specific area affected by a given drought incidence. Usually, severe and extreme drought episodes cover wider areas, while mild and moderate drought episodes tend to affect localized areas
.
This study focuses on the spatial and temporal Analysis of meteorological drought in the North Shewa zone, Oromia, Ethiopia, using better satellite rainfall products. For this purpose, CHIRPS satellite rainfall products were first evaluated with respect to ground-observed station data to identify and recommend the best satellite-derived rainfall product for drought monitoring in this study area. The main objective of this study is to assess the spatiotemporal occurrence of Meteorological Drought from 1990-2020 over the North Shewa Zone, Oromia, Ethiopia, and compare the row satellite data with the bias correction and merged counterpart. This study analyzes the spatial and temporal drought characteristics over the North Shewa Zone.
2. Methodology
2.1. Study Area
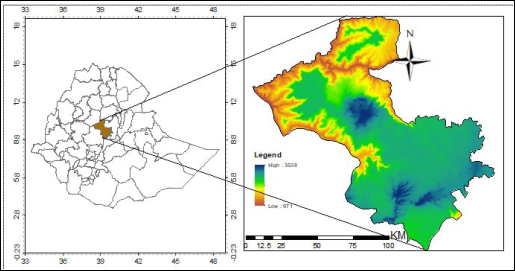
The study was conducted in the North Shewa Zone of Oromia regional state in Ethiopia. North Shewa Zone is located in the south by Addis Ababa, on the southwest by West Shewa, on the north by the Amhara Region, and on the southeast by East Shewa. The town includes Dara, Fiche, Guaracha, Aleltu, Chanco, Derba, Filkilik, Fital, Muka Turi, Sheno, Sululta, and Gohatsion. Coordinates of the zone are located between 37.92°N and 39.51°, 8.92°E and 10.41°W.
The topography is ragged terrain with some mountains. The altitude ranges between 1300 and 2500 meters above sea level. It is divided into three agro-ecologies, namely, 15% Highland, 40% Midland, and 45% Lowland
| [18] | T. Gashaw, A. Bantider, and A. Mahari, “Population dynamics and land use/land cover changes in Dera District, Ethiopia,” Glob. J. Biol. Agric. Heal. Sci, vol. 3, pp. 137-140, 2014. |
[18]
. There are two rainy seasons comprising four months each, namely Belg (February - May) and Maher (June - September)
| [19] | A. H. Shekuru, A. B. Berlie, and Y. K. Bizuneh, “Variability and trends of temperature and rainfall over three agro-ecological zones in North Shewa, Central Ethiopia,” Arab. J. Geosci., vol. 15, no. 18, p. 1495, 2022. |
[19]
. The average annual rainfall ranges from 1400 to 1600 mm, while the mean annual temperature varies between 15 and 19°C
| [20] | M. Tilahun, M. Tefesa, T. Girma, M. Milkiyas, and H. Tamirat, “Climate Change Indicators Trace for Identification of Climate Change Vulnerability in Salale Zone, Oromia Region, Ethiopia,” J Clim. Weather Forecast, vol. 9, p. 298, 2021. |
[20]
.
Figure 1. Location of the study area (North Shewa Oromia).
2.2. Data Types and Sources
Both observation and satellite data were used in this study. Daily observed rainfall data was collected from Ethiopian Meteorological Institute for 11 stations for the period 1990-2020. The satellite data was obtained from CHIRPS data from Climate Hazards Center Infrared precipitation with Station website. The observed data was obtained for 11 station over the study area, and the spatial satellite data of resolution 0.05
° was obtained for the study area
| [21] | D. S. Pai, M. Rajeevan, O. P. Sreejith, B. Mukhopadhyay, and N. S. Satbha, “Development of a new high spatial resolution (0.25× 0.25) long period (1901-2010) daily gridded rainfall data set over India and its comparison with existing data sets over the region,” Mausam, vol. 65, no. 1, pp. 1-18, 2014,
https://doi.org/10.54302/mausam.v65i1.851 |
[21]
.
2.3. Methods
In this study different tools were applied for data analysis including excel for entry, quality checking and filtering missing data; Climate data tool (CDT) for data quality checking, bias correction, comparison of station and satellite data, SPI analysis and visualization. CDT is a free and open-source R package. It was developed as part of the Enhancing National Climate Services (ENACTS) initiative by the International Research Institute for Climate and Society (IRI), part of the Earth Institute at Columbia University.
2.3.1. Bias Correction
Bias correction is used to correct the large systematic errors, which are pertinent in simulations of models and/or satellite data. In this study, the downloaded CHIRPS products of monthly precipitation was used. There are several bias correction methods for precipitation and temperature. Statistical downscaling, histogram equalization, rank matching, and quantile mapping (QM) are just a few of the bias correction approaches that have been developed
| [22] | M. Enayati, O. Bozorg-Haddad, J. Bazrafshan, S. Hejabi, and X. Chu, “Bias correction capabilities of quantile mapping methods for rainfall and temperature variables,” J. Water Clim. Chang., vol. 12, no. 2, pp. 401-419, 2021,
https://doi.org/10.2166/wcc.2020.261 |
| [23] | L. Sangelantoni, A. Russo, and F. Gennaretti, “Impact of bias correction and downscaling through quantile mapping on simulated climate change signal: a case study over Central Italy,” Theor. Appl. Climatol., vol. 135, no. 1, pp. 725-740, 2019. |
[22, 23]
. In this study, the Quantile Mapping (QM) technique was used to correct the biases of CHIRPS data.
From the QM techniques, the Empirical Quantile Mapping (EQM) was selected in this study. EQM maps the Cumulative Distribution Functions (CDFs) between the satellite and observed data, which are empirically constructed, based on data from a historical period.
2.3.2. Merging the Station and Satellite Data
The station and bias-adjusted satellite data were merged by using the R package CDT. The merging method used was simple bias adjustment, and the resolution was similar to the grid of the satellite data.
2.3.3. Visualization
The climate data tools (CDT) were also used to visualize the outputs of the analysis. Spatial map, temporal time series graph, the cumulative distribution function, and a map of performance rank are used to visualize the results of the study.
2.3.4. The Standardized Precipitation Index (SPI)
The SPI calculation for any location is based on the long-term precipitation record for a desired period. This long-term record is fitted to a probability distribution, which is then transformed into a normal distribution so that the mean SPI for the location and desired period is zero
| [24] | M. J. Hayes, “Revisiting the SPI: clarifying the process,” 2000. |
[24]
. Positive SPI values indicate greater than median precipitation, and negative values indicate less than median precipitation. Because the SPI is normalized, wetter and drier climates can be represented in the same way; thus, wet periods can also be monitored using the SPI, using the classification system shown in the SPI value table below
Table 1 (
Table 1) to define drought intensities resulting from the SPI
| [24] | M. J. Hayes, “Revisiting the SPI: clarifying the process,” 2000. |
[24]
. They also defined the criteria for a drought event for any of the timescales. A drought event occurs any time the SPI is continuously negative and reaches an intensity of -1.0 or less. The event ends when the SPI becomes positive. Each drought event, therefore, has a duration defined by its beginning and end, and an intensity for each month that the event continues. The positive sum of the SPI for all the months within a drought event can be termed the drought’s “magnitude”.
Table 1. SPI values indices.
2.0+ | Extremely wet |
1.5 to 1.99 | Very wet |
1.0 to 1.49 | Moderately wet |
-0.99 to 0.99 | Near normal |
-1.0 to -1.49 | Moderately dry |
-1.5 to -1.99 | Severely dry |
-2 and less | Extremely dry |
Probability Distribution Function to Calculate SPI
To define the precipitation deficit, SPI is determined by fitting the accumulated precipitation with an effective probability density function. The two-parameter gamma distribution is used as a probability function to match the accumulated precipitation for each month, analyzed the effects of fitting in different probability density functions on the SPI value
| [25] | P. Zhang, B. Li, M. E. Y. Boudaren, J. Yan, M. Li, and Y. Wu, “Parameter estimation of generalized gamma distribution toward SAR image processing,” IEEE Trans. Aerosp. Electron. Syst., vol. 56, no. 5, pp. 3701-3717, 2020.
https://doi.org/10.1109/TAES.2020.2977790 |
| [26] | N. B. Guttman, “Accepting the standardized precipitation index: A calculation algorithm,” J. Am. Water Resour. Assoc., vol. 35, no. 2, pp. 311-322, 1999,
https://doi.org/10.1111/j.1752-1688.1999.tb03592.x |
[25, 26]
. They found that there is no significant effect on the value, but the Gamma distribution is the fittest one. The gamma probability distribution provides better representation of the precipitation data
| [27] | P. Angelidis, F. Maris, N. Kotsovinos, and V. Hrissanthou, “Computation of drought index SPI with alternative distribution functions,” Water Resour. Manag., vol. 26, no. 9, pp. 2453-2473, 2012. |
[27]
. Based on the above recommendations, the SPI computation was based on the Gamma distribution function.
SPIs was calculated using the procedure defined by
| [28] | D. C. Edwards, “Characteristics of 20th century drought in the united states at multiple time scales.,” 1997. |
[28]
, with monthly precipitation data. Precipitation will be averaged over the time scale of interest (4-month in this study), separately for each month up to and including this month. The set of three/twelve-monthly values of cumulative precipitation is then fitted with a gamma distribution. Which is defined as, according to
.
Where, α is a shape parameter (α>0), β is a scale parameter (β>0), x is the precipitation amount (x>0), and
Where, is the gamma function.
The different SPI indicators allow for estimating different possible impacts of a meteorological drought since SPI can be estimated over different precipitation accumulation periods (typically varying from 1 to 48 months)
| [30] | M. Svoboda, M. Hayes, and D. Wood, “Standardized precipitation index: user guide,” 2012. |
[30]
. In this study, 4-month SPI was used.
The 4-month SPI compares precipitation totals for a given 4-month period to precipitation totals for the same 4-month period for all of the years in the historical record. A 4-month SPI represents short- and medium-term moisture conditions, as well as seasonal precipitation estimates
| [16] | T. B. McKee, N. J. Doesken, and J. Kleist, “The relationship of drought frequency and duration to time scales,” in Proceedings of the 8th Conference on Applied Climatology, California, 1993, pp. 179-183. |
| [29] | E. K. Vizy and K. H. Cook, “Connections between the summer east African and Indian rainfall regimes,” vol. 108, pp. 1-19, 2003, https://doi.org/10.1029/2003JD003452 |
| [31] | WMO, “Guidelines on the Calculation of Climate Normals,” WMO-No. 1203, no. 1203, p. 29, 2017, [Online]. Available:
https://library.wmo.int/doc_num.php?explnum_id=4166© |
[16, 29, 31]
. The 4-month SPI will be used to detect and characterize seasonal drought events.
2.3.5. Drought Characteristics
When the SPI falls below a threshold value, which is -1, a drought event is assumed to have occurred
| [16] | T. B. McKee, N. J. Doesken, and J. Kleist, “The relationship of drought frequency and duration to time scales,” in Proceedings of the 8th Conference on Applied Climatology, California, 1993, pp. 179-183. |
[16]
. The mean value of a drought index below the threshold level is used to determine the severity of a drought occurrence.
3. Result and Discussion
3.1. Comparison of the Raw, Adjusted, and Merged Satellite Data
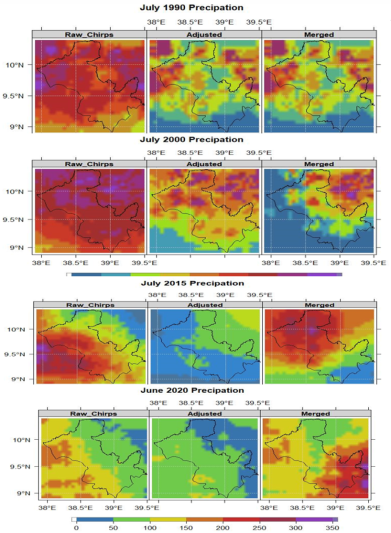
Rainfall distribution over the study area for the study period sample is presented in the figures below. Sample of precipitation for the month July in the years 1990, 2000, 2010, and 2020 are presented below. The figures show that the adjusted chirps get more precipitation than row and merged chirps except 2010. During 1990 merged chirps get precipitation us equals to Adjusted chirps these show that within ten-year gap of climate Adjusted chirp get good precipitation over the study area.
Figure 2. Precipitation comparisons between Row Chirps, Adjusted, and Merged in the periods between 1990-2000-2010-2020.
On July 2015, the Chirps and the merged data shows uniform precipitation distribution, intensity and amount. However, Adjusted data shows as compere with chirps and merged estimate under normal condition.
3.2. Validation
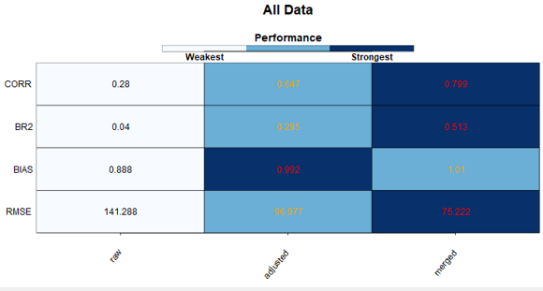
In this section from the result of statistical correlation (CORR), coefficient of bias (BR2) Bias (BIAS), and Root Mean Square Error (RMSE) comparing with row, adjusted and merged data shows the merged dataset reproduces the observed station data better than the raw and bias adjusted satellite data.
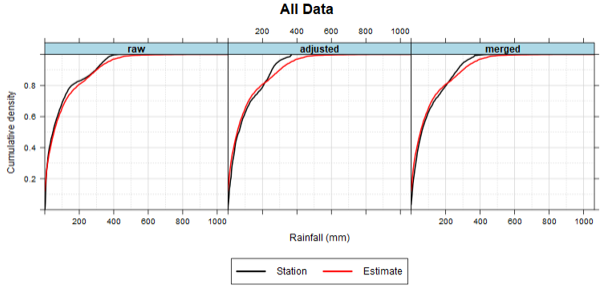
Figure 3. Cumulative Distribution map of raw, adjusted, and merged data sets vs the observed stations data.
Figure 3 above depicts the comparison between cumulative distribution of rainfall data between the station and satellite estimates in terms of raw, adjusted, and merged data. The figure indicates that the bias-adjusted data is closer to the station data, next to the merged data.
Figure 4. Performance rank of raw, adjusted and merged datasets in reproducing the observed precipitation data.
The
Figure 4 above indicate that the comparison between performance of Raw, Adjusted, and Merged datasets in terms of with relate to CORR, BR2, BIAS, and RMSE. The result show that merged data is stronger than row and adjusted data in reproducing the observed station data.
3.3. Temporal Drought Characteristics
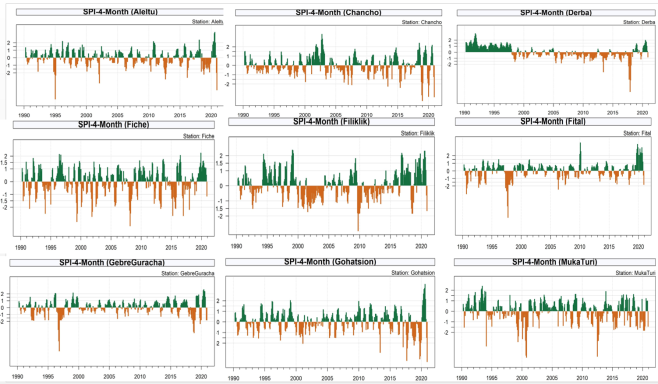
During the study period (1990-2020), the results of SPEI-4 for 11 stations in the study area shown range of 41-62 drought events which is the number of months with SPI value of less than or equal to -1. Thus, the station where maximum drought events occurred is the meteorology station named Fiche with 62 months of SPI value less than the threshold (-1), whereas the meteorology station Chancho is the station with least drought events over the period with 41 drought events. In terms of the drought classes, the meteorology station Fiche is the station where maximum extreme drought (SPI<=-2) events occurred with 16 months, while only one extreme drought event occurred at Filkilik. The highest number of severe drought (-1.5<=SPI<-2) incidences occurred in single station was 23 months at Gebre Guracha, while the least is 8 at Derba and Sululta meteorology stations. 15 and 36 months are the highest and least moderate drought events occurred in a single station at Fital and Filkilik stations respectively.
The figures below depict the temporal time series map of SPI for 4-month timescale for all stations.
Figure 5. The temporal time series of SPI for 4-month timescale for all stations.
The period 1990 to 1993 was drought period over Sululta station. In this period, extreme drought events were also observed. In the years 1997 and 2020, two extreme drought events were evident.
3.4. Extreme Drought Events in the Rainy Seasons
3.4.1. Belg
The Belg (February to May) season in this study defined to include 4 months from February to May. The results of 4-month SPI value of the month May was used to describe the characteristics of drought the Belg season, because it is the cumulative of the previous four months, which are defined to be Belg Based on the results, six extreme droughts have been seen in the years 1997, 1999, 2006, 2013, and 2018. The extreme drought was occurred at Fital in the years 1997 and 2006; Fiche in 1999 and 2013, Muka Turi in 1999, and Sululta in 2018.
Fiche and Fital are the stations which experience the highest (2) extreme drought events.
3.4.2. Kiremt
The SPI-4 values of the month September were used to characterize seasonal drought in Kiremt, since it is the cumulative four months from June-September. Extreme drought events in Kiremt were recorded in ten of the years with at least one station a year. The years with extreme drought events in the Kiremt were 1990, 1991, 1996, 1997, 2000, 2012, 2013, 2015, 2017, and 2018. Fital, Gebre Guracha, Sululta, and Muka Turi experience two extreme droughts in the Kiremt; while Chancho and Filkilik have not seen any extreme drought event in the Kiremt season.
3.5. Spatial Drought in the Rainy Seasons
The spatial characteristics of drought was quantified by identifying number of stations with significant drought events for each month over the study period. Then months with highest number of stations with significant drought are presented in the following figures.
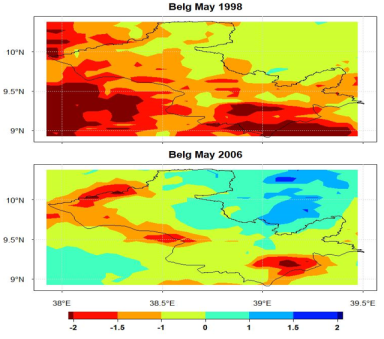
Figure 6. Drought events in Belg with highest spatial coverage; Belg of 1998 had 6 stations with significant drought (SPI value <=-1) out of 11 and Belg of 2006 had 7 stations with significant drought.
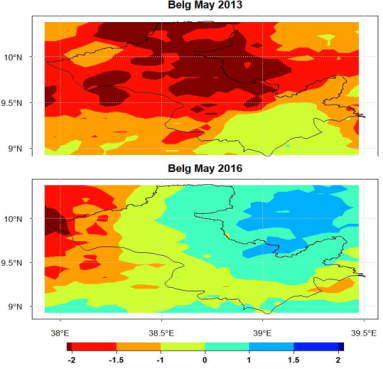
Figure 7. Drought events in Belg with higher spatial coverage; Belg of 2013 and 2016 similarly had 5 stations with significant drought events (SPI value of<=-1).
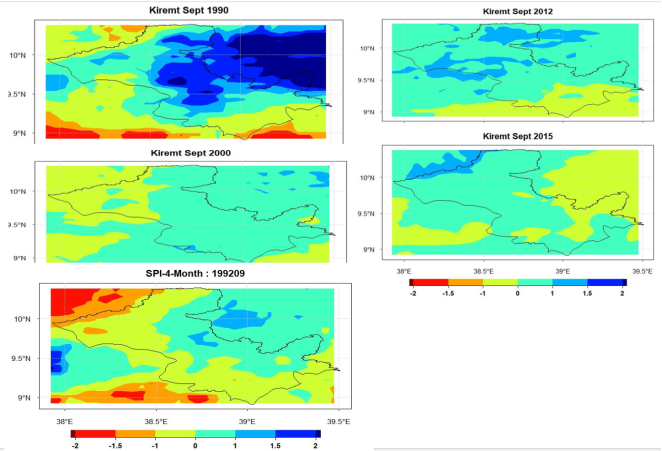
The figures below depict the drought events with higher spatial coverage in the Kiremt rainy season over the study area. As can be seen from the figures, the Kiremt season in the years 1992 and 2000 had the highest spatially spread drought with 5 stations under significant drought (SPI<=-1) out of 11 stations over the study area. Following the years 1992 and 2000, the years 1990, 2012, 2015, and 2018 had 3 stations under significant drought events which were the second highest.
Figure 8. Drought events with higher spatial coverage in the Kiremt rainy season.
4. Conclusion and Recommendation
The analysis of drought patterns is vital to address the various risks of droughts. This study takes a particular look at the droughts over North Shewa to help address the core challenges of droughts. The observed station precipitation data are used to analyze the temporal drought, while the station and bias-corrected satellite merged data were used to analyze the spatial drought. The standardized precipitation index was used to characterize the drought classes and patterns. The data preprocessing results revealed that bias correction improves the agreement of satellite data with station-observed data. Moreover, the merged (station and bias-corrected CHIRPS) data reproduces precipitation data nearly similar to the ground-observed data.
Drought patterns over North Shewa were found to be complex with time and space. Both dry and wet periods are observed based on the SPEI-4 result over the stations. The pattern of shift between dry and wet periods is found to be not uniform for some stations and nearly uniform for others. Moreover, the drought incidences at each of the stations had diverse magnitudes and durations. Fiche and Chancho are found to be the stations with the highest and least drought events over the period 1990-2020, respectively. We also find that the occurrence of different drought classes (extreme, severe, and moderate) varies complexly across stations and periods.
The analysis of drought events in the rainy seasons revealed that the years 2006, 1998, 2013, and 2016 are the top driest seasons in Belg, ordered from the top driest, and 1992, 2009, 1990, 2012, and 2015 are the years when there was the highest spatially spread drought in the Kiremt season over the study area. Extreme drought events occur more frequently in the Kiremt season than in the Belg. There has been an extreme drought in the Kiremt season in 10 of the years out of 31 in the study area, while in the Belg season, there have been extreme drought events in only 5 of the years. More research is needed to fill gaps in understanding different types of drought in the region. Future research can look into different spatial scales and compare the performance of different drought indices in the region. It will also be useful to do case studies with patterns of drought emergence.
One of the limitations of the study is the availability and adequacy of the data set archives used. Therefore, improvement of meteorological monitoring over the region will greatly improve drought monitoring in support of key decisions. Using the merged satellite and station data can solve the problem of data availability if it is done in a proper way by correcting the biases of the satellite data and choosing appropriate methods to do so. Validating the products of satellite data is important and hence recommended before using them in a drought analysis. It has been seen that the raw, adjusted, and merged satellite data perform differently in reproducing the observed climate data.
Abbreviations
BR2 | Coefficient of Bias |
BIAS | Bias |
CDFs | Cumulative Distribution Functions |
CDT | Climate Data Tools |
CORR | Correlation |
CHIRPS | Climate Hazards Group Infrared Precipitation with Stations |
EMI | Ethiopia Meteorological Institute |
ENACTS | Enhancing National Climate Services |
EQM | Empirical Quantile Mapping |
IRI | Institute for Climate Society |
NetCDF | Network Common Data Form |
QM | Quantile Mapping |
RMSE | Root Mean Square Error |
SPEI | Standard Precipitation Evaporation Index |
SPI | Standard Precipitation Index |
Conflicts of Interest
There are no conflicts of interest or other interests of the authors that could be believed to influence the discussion or results presented in this study.
References
| [1] |
M. V. K. Sivakumar, R. Stefanski, M. Bazza, S. Zelaya, D. Wilhite, and A. R. Magalhaes, “High level meeting on national drought policy: Summary and major outcomes,” Weather Clim. Extrem., vol. 3, pp. 126-132, 2014,
https://doi.org/10.1016/j.wace.2014.03.007
|
| [2] |
G. Laaha et al., “The European 2015 drought from a hydrological perspective,” Hydrol. Earth Syst. Sci., vol. 21, no. 6, pp. 3001-3024, 2017,
https://doi.org/10.5194/hess-21-3001-2017
|
| [3] |
D. A. Wilhite, “Drought,” in International Perspectives on Natural Disasters: Occurrence, Mitigation, and Consequences, Springer, 2007, pp. 147-162.
|
| [4] |
A. P. A. Gutiérrez, N. L. Engle, E. De Nys, C. Molejón, and E. S. Martins, “Drought preparedness in Brazil,” Weather Clim. Extrem., vol. 3, pp. 95-106, 2014,
https://doi.org/10.1016/j.wace.2013.12.001
|
| [5] |
B. I. Cook, J. S. Mankin, and K. J. Anchukaitis, “Climate change and drought: From past to future,” Curr. Clim. Chang. Reports, vol. 4, no. 2, pp. 164-179, 2018.
|
| [6] |
M. R. Pantula, Drought early warning system: Identification of onset end magnitude (SPI and SPEI) and composite index. Notion Press, 2016.
|
| [7] |
J. Spinoni, G. Naumann, H. Carrao, P. Barbosa, and J. Vogt, “World drought frequency, duration, and severity for 1951-2010,” Int. J. Clim., vol. 34, no. 8, pp. 2792-2804, 2014.
|
| [8] |
D. A. Wilhite, M. J. Hayes, and C. L. Knutson, “Drought preparedness planning: Building institutional capacity,” Drought water Cris. Sci. Technol. Manag. issues, vol. 107, pp. 93-136, 2005.
|
| [9] |
P. Webb and J. Van Braun, “Drought and food shortages in Ethiopia,” A Prelim. Rev. Eff. policy Implic. IFPRI, Washingt. DC, 1990.
|
| [10] |
J. A. Dracup, K. S. Lee, and E. G. Paulson Jr, “On the definition of droughts,” Water Resour. Res., vol. 16, no. 2, pp. 297-302, 1980,
https://doi.org/10.1029/WR016i002p00297
|
| [11] |
D. A. Wilhite and M. H. Glantz, “Understanding: the drought phenomenon: the role of definitions,” Water Int., vol. 10, no. 3, pp. 111-120, 1985,
https://doi.org/10.1080/02508068508686328
|
| [12] |
H. Hisdal, “Regional aspects of drought,” Disertation. Fac. Math. Nat. Sci. Univ. Oslo, Norge, 2002.
|
| [13] |
J. Sheffield and E. F. Wood, Drought: past problems and future scenarios. Routledge, 2012,
https://doi.org/10.4324/9781849775250
|
| [14] |
A. Zargar, R. Sadiq, B. Naser, and F. I. Khan, “A review of drought indices,” Environ. Rev., vol. 19, no. 1, pp. 333-349, 2011,
https://doi.org/10.1139/a11-013
|
| [15] |
M. A. Degefu and W. Bewket, “Trends and spatial patterns of drought incidence in the Omo-Ghibe River Basin, Ethiopia,” Geogr. Ann. Ser. A Phys. Geogr., vol. 97, no. 2, pp. 395-414, 2015,
https://doi.org/10.1111/geoa.12080
|
| [16] |
T. B. McKee, N. J. Doesken, and J. Kleist, “The relationship of drought frequency and duration to time scales,” in Proceedings of the 8th Conference on Applied Climatology, California, 1993, pp. 179-183.
|
| [17] |
Q. Wang et al., “Temporal-spatial characteristics of severe drought events and their impact on agriculture on a global scale,” Quat. Int., vol. 349, pp. 10-21, 2014,
https://doi.org/10.1016/j.quaint.2014.06.021
|
| [18] |
T. Gashaw, A. Bantider, and A. Mahari, “Population dynamics and land use/land cover changes in Dera District, Ethiopia,” Glob. J. Biol. Agric. Heal. Sci, vol. 3, pp. 137-140, 2014.
|
| [19] |
A. H. Shekuru, A. B. Berlie, and Y. K. Bizuneh, “Variability and trends of temperature and rainfall over three agro-ecological zones in North Shewa, Central Ethiopia,” Arab. J. Geosci., vol. 15, no. 18, p. 1495, 2022.
|
| [20] |
M. Tilahun, M. Tefesa, T. Girma, M. Milkiyas, and H. Tamirat, “Climate Change Indicators Trace for Identification of Climate Change Vulnerability in Salale Zone, Oromia Region, Ethiopia,” J Clim. Weather Forecast, vol. 9, p. 298, 2021.
|
| [21] |
D. S. Pai, M. Rajeevan, O. P. Sreejith, B. Mukhopadhyay, and N. S. Satbha, “Development of a new high spatial resolution (0.25× 0.25) long period (1901-2010) daily gridded rainfall data set over India and its comparison with existing data sets over the region,” Mausam, vol. 65, no. 1, pp. 1-18, 2014,
https://doi.org/10.54302/mausam.v65i1.851
|
| [22] |
M. Enayati, O. Bozorg-Haddad, J. Bazrafshan, S. Hejabi, and X. Chu, “Bias correction capabilities of quantile mapping methods for rainfall and temperature variables,” J. Water Clim. Chang., vol. 12, no. 2, pp. 401-419, 2021,
https://doi.org/10.2166/wcc.2020.261
|
| [23] |
L. Sangelantoni, A. Russo, and F. Gennaretti, “Impact of bias correction and downscaling through quantile mapping on simulated climate change signal: a case study over Central Italy,” Theor. Appl. Climatol., vol. 135, no. 1, pp. 725-740, 2019.
|
| [24] |
M. J. Hayes, “Revisiting the SPI: clarifying the process,” 2000.
|
| [25] |
P. Zhang, B. Li, M. E. Y. Boudaren, J. Yan, M. Li, and Y. Wu, “Parameter estimation of generalized gamma distribution toward SAR image processing,” IEEE Trans. Aerosp. Electron. Syst., vol. 56, no. 5, pp. 3701-3717, 2020.
https://doi.org/10.1109/TAES.2020.2977790
|
| [26] |
N. B. Guttman, “Accepting the standardized precipitation index: A calculation algorithm,” J. Am. Water Resour. Assoc., vol. 35, no. 2, pp. 311-322, 1999,
https://doi.org/10.1111/j.1752-1688.1999.tb03592.x
|
| [27] |
P. Angelidis, F. Maris, N. Kotsovinos, and V. Hrissanthou, “Computation of drought index SPI with alternative distribution functions,” Water Resour. Manag., vol. 26, no. 9, pp. 2453-2473, 2012.
|
| [28] |
D. C. Edwards, “Characteristics of 20th century drought in the united states at multiple time scales.,” 1997.
|
| [29] |
E. K. Vizy and K. H. Cook, “Connections between the summer east African and Indian rainfall regimes,” vol. 108, pp. 1-19, 2003,
https://doi.org/10.1029/2003JD003452
|
| [30] |
M. Svoboda, M. Hayes, and D. Wood, “Standardized precipitation index: user guide,” 2012.
|
| [31] |
WMO, “Guidelines on the Calculation of Climate Normals,” WMO-No. 1203, no. 1203, p. 29, 2017, [Online]. Available:
https://library.wmo.int/doc_num.php?explnum_id=4166©
|
Cite This Article
-
APA Style
Fana, T. B., Wakete, M. T. (2025). Meteorological Drought Analysis by Using CHRIPSv2 Satellite Remote Sensing and Station Data over North Shewa Zone, Oromia, Ethiopia. American Journal of Remote Sensing, 13(2), 100-109. https://doi.org/10.11648/j.ajrs.20251302.14
 Copy
|
Copy
|
 Download
ACS Style
Fana, T. B.; Wakete, M. T. Meteorological Drought Analysis by Using CHRIPSv2 Satellite Remote Sensing and Station Data over North Shewa Zone, Oromia, Ethiopia. Am. J. Remote Sens. 2025, 13(2), 100-109. doi: 10.11648/j.ajrs.20251302.14
Copy
|
Download
AMA Style
Fana TB, Wakete MT. Meteorological Drought Analysis by Using CHRIPSv2 Satellite Remote Sensing and Station Data over North Shewa Zone, Oromia, Ethiopia. Am J Remote Sens. 2025;13(2):100-109. doi: 10.11648/j.ajrs.20251302.14
Copy
|
Download
-
@article{10.11648/j.ajrs.20251302.14,
  author = {Tsige Berhanu Fana and Mesay Tolossa Wakete},
  title = {Meteorological Drought Analysis by Using CHRIPSv2 Satellite Remote Sensing and Station Data over North Shewa Zone, Oromia, Ethiopia},
  journal = {American Journal of Remote Sensing},
  volume = {13},
  number = {2},
  pages = {100-109},
  doi = {10.11648/j.ajrs.20251302.14},
  url = {https://doi.org/10.11648/j.ajrs.20251302.14},
  eprint = {https://article.sciencepublishinggroup.com/pdf/10.11648.j.ajrs.20251302.14},
  abstract = {The North Shewa zone of Ethiopia is highly vulnerable to drought. The majority of the population of the zone is involved in agricultural activities for their livelihood. Agriculture is predominantly dependent on the timing, amount, duration, and distribution of natural rainfall. This makes the zone susceptible to the impacts of climatic extreme events such as drought. Yet, no drought assessment studies have been conducted on the spatial and temporal analysis of recent droughts over the zone. In view of that, this study examined the spatial and temporal characteristics of drought in the period 1990 to 2020 over the North Shewa zone of Oromia regional state, Ethiopia, using the Standardized Precipitation Index (SPI) drought index. The drought events at each of the stations had varying magnitudes and occurrences. During Kiremt (JJAS), seasonal drought was more frequent than Belg (FMAM). The years 2006, 1998, 2013, and 2016 are the top driest seasons in Belg (ordered from high to low spatial coverage); and 1992, 2009, 1990, 2012, and 2015 are the years when there was the highest spatially spread drought in the Kiremt (June-September) season. The comparison between the performance of Raw, Adjusted, and Merged datasets in terms of with relation to CORR, BR2, BIAS, and RMSE. The results show that merged data is stronger than row and adjusted data in reproducing the observed station data.},
 year = {2025}
}
Copy
|
Download
-
TY  - JOUR
T1  - Meteorological Drought Analysis by Using CHRIPSv2 Satellite Remote Sensing and Station Data over North Shewa Zone, Oromia, Ethiopia
AU  - Tsige Berhanu Fana
AU  - Mesay Tolossa Wakete
Y1  - 2025/12/11
PY  - 2025
N1  - https://doi.org/10.11648/j.ajrs.20251302.14
DO  - 10.11648/j.ajrs.20251302.14
T2  - American Journal of Remote Sensing
JF  - American Journal of Remote Sensing
JO  - American Journal of Remote Sensing
SP  - 100
EP  - 109
PB  - Science Publishing Group
SN  - 2328-580X
UR  - https://doi.org/10.11648/j.ajrs.20251302.14
AB  - The North Shewa zone of Ethiopia is highly vulnerable to drought. The majority of the population of the zone is involved in agricultural activities for their livelihood. Agriculture is predominantly dependent on the timing, amount, duration, and distribution of natural rainfall. This makes the zone susceptible to the impacts of climatic extreme events such as drought. Yet, no drought assessment studies have been conducted on the spatial and temporal analysis of recent droughts over the zone. In view of that, this study examined the spatial and temporal characteristics of drought in the period 1990 to 2020 over the North Shewa zone of Oromia regional state, Ethiopia, using the Standardized Precipitation Index (SPI) drought index. The drought events at each of the stations had varying magnitudes and occurrences. During Kiremt (JJAS), seasonal drought was more frequent than Belg (FMAM). The years 2006, 1998, 2013, and 2016 are the top driest seasons in Belg (ordered from high to low spatial coverage); and 1992, 2009, 1990, 2012, and 2015 are the years when there was the highest spatially spread drought in the Kiremt (June-September) season. The comparison between the performance of Raw, Adjusted, and Merged datasets in terms of with relation to CORR, BR2, BIAS, and RMSE. The results show that merged data is stronger than row and adjusted data in reproducing the observed station data.
VL  - 13
IS  - 2
ER  -
Copy
|
Download